
import GraphicsLayer from '@arcgis/core/layers/GraphicsLayer';
import MapView from '@arcgis/core/views/MapView';
import * as geometryEngine from '@arcgis/core/geometry/geometryEngine';
import Draw from '@arcgis/core/views/draw/Draw';
import Polyline from '@arcgis/core/geometry/Polyline';
import SpatialReference from '@arcgis/core/geometry/SpatialReference';
import Graphic from '@arcgis/core/Graphic';
import SimpleMarkerSymbol from '@arcgis/core/symbols/SimpleMarkerSymbol';
import SimpleLineSymbol from '@arcgis/core/symbols/SimpleLineSymbol';
import * as webMercatorUtils from '@arcgis/core/geometry/support/webMercatorUtils';
import SimpleFillSymbol from '@arcgis/core/symbols/SimpleFillSymbol';
import Point from '@arcgis/core/geometry/Point';
import * as turf from '@turf/turf';
import TextSymbol from '@arcgis/core/symbols/TextSymbol';
import Polygon from '@arcgis/core/geometry/Polygon';
type drawType = 'point' | 'multipoint' | 'polyline' | 'polygon' | 'rectangle' | 'circle' | 'ellipse' | '';
interface IOptions {
    view: MapView;
}
export default class Measurement {
    view: MapView;
    draw: Draw;
    layer: GraphicsLayer;
    action: __esri.DrawAction | undefined;
    private _lineSymbol: SimpleLineSymbol;
    private _markerSymbol: SimpleMarkerSymbol;
    private _polygonSymbol: SimpleFillSymbol;
    pointLayer: GraphicsLayer;
    type: drawType;
    constructor(options: IOptions) {
        const { view } = options;
        this.view = view;
        this.draw = new Draw({ view });
        this.layer = new GraphicsLayer();
        this.pointLayer = new GraphicsLayer();
        this.init();
        this._lineSymbol = new SimpleLineSymbol({
            color: [226, 119, 40],
            width: 4,
        });
        this._markerSymbol = new SimpleMarkerSymbol({
            color: [226, 119, 40],
            size: 8,
            outline: {
                // autocasts as new SimpleLineSymbol()
                color: [255, 255, 255],
                width: 1,
            },
        });
        this._polygonSymbol = new SimpleFillSymbol({
            color: [227, 139, 79, 0.8],
            outline: {
                // autocasts as new SimpleLineSymbol()
                color: [255, 255, 255],
                width: 1,
            },
        });
        this.type = '';
    }
    init() {
        this.view.map.add(this.layer);
        this.view.map.add(this.pointLayer);
    }
    create(type: drawType) {
        this.type = type;
        const { draw } = this;

        this.action = draw.create(type as any, { mode: 'click' });
        this.action.on('vertex-add', evt => {
            if (type === 'polyline') {
                this.createLine(evt.vertices);
            }
            if (type === 'polygon') {
                this.createPolygon(evt.vertices);
            }

            this.createPoint(evt.vertices);
        });
        // this.action.on('draw-complete', evt => {
        //     console.log(evt.vertices, 'complete');
        // });
        this.action.on('cursor-update', evt => {
            if (type === 'polyline') {
                this.createLine(evt.vertices);
            }
            if (type === 'polygon') {
                this.createPolygon(evt.vertices);
            }
        });
    }
    createLine(vertices: any[]) {
        const { view, layer } = this;
        layer.removeAll();

        let polyline = new Polyline({
            paths: vertices,
            spatialReference: view.spatialReference,
        });
        const graphic = new Graphic({
            geometry: polyline,
            symbol: this._lineSymbol,
        });
        layer.add(graphic);
    }
    createPolygon(vertices: any[]) {
        const { view, layer } = this;
        layer.removeAll();
        let polyline = new Polygon({
            rings: [vertices],
            spatialReference: view.spatialReference,
        });
        const graphic = new Graphic({
            geometry: polyline,
            symbol: this._polygonSymbol,
        });
        layer.add(graphic);
    }
    createPoint(vertices: any[]) {
        const { view, layer, _markerSymbol } = this;
        this.pointLayer.removeAll();

        const graphics = vertices.map(item => {
            const point = new Point({
                x: item[0],
                y: item[1],
                spatialReference: view.spatialReference,
            });
            const graphic = new Graphic({
                geometry: point,
                symbol: _markerSymbol,
            });
            return graphic;
        });

        this.pointLayer.addMany(graphics);
        if (vertices.length > 1 && this.type) {
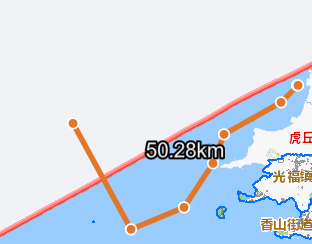
            if (this.type === 'polyline') {
                const line = turf.lineString(vertices);
                const length = turf.length(line, { units: 'kilometers' }).toFixed(2) + 'km';
                let polyline = new Polyline({
                    paths: vertices,
                    spatialReference: view.spatialReference,
                });
                const center = polyline.extent.center;
                this.addLabel(center, length);
            }
        }
        const polygons = [...vertices];
        polygons.push(vertices[0]);
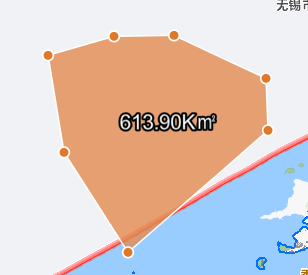
        if (vertices.length >= 3 && this.type) {
            if (this.type === 'polygon') {
                // console.log(vertices, 'vertices');
                const polygon = turf.polygon([polygons]);

                const area = (turf.area(polygon) / 1000000).toFixed(2) + 'K㎡';
                let geometory = new Polygon({
                    rings: [vertices],
                    spatialReference: view.spatialReference,
                });
                console.log(geometory.centroid, 'polygon');
                const center = geometory.centroid;
                this.addLabel(center, area);
            }
        }
    }
    addLabel(center: any, length: string) {
        const graphic = new Graphic({
            geometry: center,
            symbol: new TextSymbol({
                text: length,
                haloColor: 'black',
                haloSize: '2px',
                color: 'white',
                font: {
                    // autocasts as new Font()
                    size: 16,
                },
            }),
        });
        this.pointLayer.add(graphic);
    }
    removeLayer() {
        this.pointLayer.removeAll();
        this.layer.removeAll();
    }
    destory() {
        this.removeLayer();
        this.draw.destroy();
        this.type = '';
    }
}


发表评论
侧栏公告
寄语
譬如朝露博客是一个分享前端知识的网站,联系方式11523518。
热评文章
标签列表
热门文章
友情链接