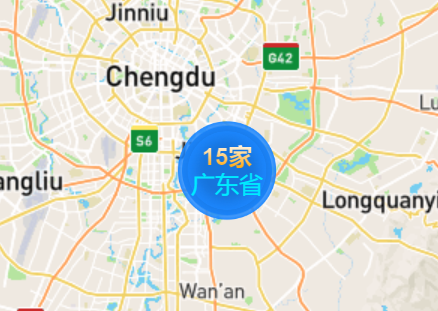
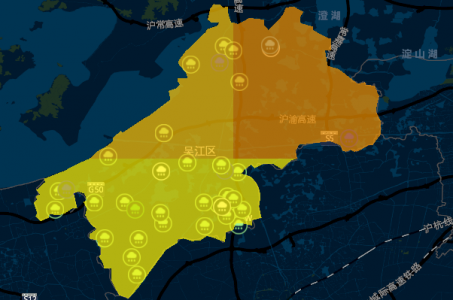
使用插件https://github.com/Igor-Vladyka/leaflet.motion
<!DOCTYPE html>
<html>

<head>
    <meta charset="utf-8" />
    <title>Clustering points</title>
    <meta name="viewport" content="initial-scale=1,maximum-scale=1,user-scalable=no" />

    <!-- Load Leaflet from CDN-->
    <link rel="stylesheet" href="./esri-leaflet-v2.5.3/leaflet.css" />
    <script src="./esri-leaflet-v2.5.3/leaflet.js"></script>

    <!-- Load Esri Leaflet -->
    <script src="./esri-leaflet-v2.5.3/esri-leaflet.js"></script>

    <link rel="stylesheet" type="text/css"
        href="./esri-leaflet-v2.5.3/leaflet.markercluster/dist/MarkerCluster.Default.css">
    <link rel="stylesheet" type="text/css" href="./esri-leaflet-v2.5.3/leaflet.markercluster/dist/MarkerCluster.css">
    <script src="./esri-leaflet-v2.5.3/leaflet.markercluster/dist/leaflet.markercluster.js"></script>
    <script src="./esri-leaflet-v2.5.3/esri-leaflet-cluster/dist/esri-leaflet-cluster.js"></script>

    <script src="./leaflet.motion.js"></script>
    <style>
        body {
            margin: 0;
            padding: 0;
        }

        #map {
            position: absolute;
            top: 0;
            bottom: 0;
            right: 0;
            left: 0;
        }
    </style>
</head>

<body>

    <div id="map"></div>

    <script>
        var carIcon = L.icon({
            iconUrl: './images/marker-bike-green-shadowed.png',
            iconSize: [25.1, 25],
        });
        // var map = L.map('map').setView([0, 0], 2);
        var map = L.map('map', {
            zoomControl: false
        }).setView([30.65, 104.05], 10);

        L.esri.basemapLayer('Streets').addTo(map);
        L.motion.polyline([
            [30.65, 104.05],
            [30.65, 104.10],
            [30.65, 104.15],
            [30.70, 104.15],
            [30.75, 104.15],
        ], {
            color: 'red'
        }, {
            auto: true,
            duration: 1000,
            easing: L.Motion.Ease.easeInOutQuart
        }, {
            removeOnEnd: false,
            icon: carIcon
        }).addTo(map);

    </script>

</body>

</html>


发表评论
侧栏公告
寄语
譬如朝露博客是一个分享前端知识的网站,联系方式11523518。
热评文章
标签列表
热门文章
友情链接